


If you’re sifting through error emails to troubleshoot issues in Salesforce, well, you have our sympathies.
And we’re here to tell you there’s a better way. A much better way. One that will cut troubleshooting research down from hours (or even days) to minutes.
You might be thinking, “Ah yes, logging!” That would be a good guess. But there’s a troubleshooting strategy that’s an order of magnitude better than logging.
Not that there’s anything wrong with logs, per se. They’ve been a part of the software universe since the creation of code. But there’s a fundamental reality to address:
Salesforce, in its standard set-up, doesn’t generate logs. None. Nada.
What it generates instead are those cryptic error emails, the ones that arrive each week by the dozens, hundreds, even thousands at some organizations. In many companies, those emails sit in an alias inbox, unloved and unread – until that moment when a line of code breaks or a flow crashes. Only then, as the support requests start piling up, is some poor soul tasked with sifting through each message in search of a nugget of insight.
You do have better options. You just have to know where to look. Here’s a nickel tour of the stronger troubleshooting options that Salesforce and third-party vendors offer.
The Pros and Cons of Logging
For any semblance of logging in Salesforce, you need to venture into the platform’s back alleys, to places like the Developer Console.
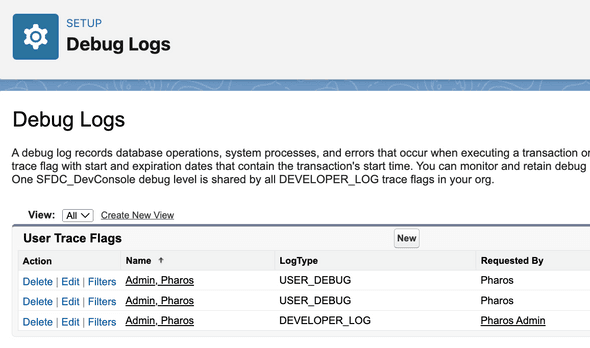
There you’ll find the utility Debug Logs, which can help you track events that occur in your org. This tool can be quite useful if you're trying to understand the nitty gritty of a particular problem.
However, there are restrictions imposed on the Debug Logs feature that keep it from being viable for any efforts beyond short-term troubleshooting. For example, Debug Logs can only run for a maximum of 24 hours. If the error doesn’t reveal itself during that short window, you won’t capture it.
There are other blind spots too. Some types of transactions aren’t captured, and some scenarios will cause Debug Logs to fail. You’ll also need to work fast. Debug logs are retained for just seven days; system logs disappear after 24 hours.
For details on batch failures, bulk API failures, and Async failures, you’ll need to open Salesforce Setup.
There you’ll find troubleshooting data in table form. The data is embedded within the Salesforce user interface and can be difficult to extract, and the information is basic - as in, did a batch job succeed or fail?
But even knowing that is helpful. These types of failures are important to keep on top of, as they can affect data integrity, among other things. Unfortunately, since the average user can only get to this data from within Salesforce Setup, these errors often go unnoticed.
The takeaway for the default troubleshooting tools you’ll find in Salesforce is that they are little more than a first-aid kit for problems you might encounter, especially in a complex environment. If Salesforce has become mission critical for your company, you’ll need more robust tools and a proactive strategy to protect against unwanted and potentially debilitating surprises.
A Step Forward: Third-Party Logging
To augment what Salesforce offers, many support teams turn to two open source, third-party utilities: Nebula Logger and RFLIB. Both are respected logging tools that add capabilities beyond what comes standard with Salesforce.
If they have a shortcoming, it’s the inherent weaknesses of logging itself.
By definition, logs record only what occurred in the past. They show what happened, but they don’t always show why something happened, or reveal patterns, or provide insights into how to fix a problem. At best, logs offer surface views of what might be deeper issues.
Logging can also be a challenge to implement. Log too little and you risk missing errors that occur only in unusual circumstances. Log too much and you risk having to sift through massive amounts of data to get at the nugget you need.
Getting the balance right is often a process of trial-and-error. But that takes time and resources, so companies often fall into a mindset of, “at least what we have is better than nothing” and move on.
Homegrown Possibilities and Perils
Alternatively, some companies “roll their own” logging solution. Done well, this approach can provide much more troubleshooting muscle than standard Salesforce tools.
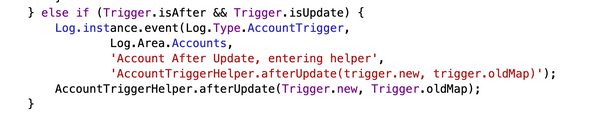
Home-grown logging uses custom code, and has the advantage of logging certain kinds of events that can’t be captured any other way, even by standard Salesforce tools.
On the flip side, the do-it-yourself approach introduces other kinds of risk, most rooted in human fallibility.
For one, custom code is often not documented well. Over time, as the original developers leave the organization, institutional memory starts to fail. Logs are abandoned or can’t be deciphered. What once might have been a vital routine is now viewed as one more bowl of spaghetti code.
Custom code can itself be buggy. We know of one enterprise that set up custom logging to identify a particular problem. The code captured the problem alright - but failed trying to log it. The support team was lulled into thinking everything was fine. Only when they deployed an observability solution, described below, did they discover the misfire.
And that’s one of the risks of custom code and of logging generally - it can provide teams with a false sense of confidence. Logging will shed light on many problems, but by its nature won’t alert you to any “unknown unknowns” lurking in your environment.
Custom Logging Woes
Whether you choose to roll your own or go with a third-party open-source option, there is one important aspect to keep in mind. Logging requires a strict developer discipline. If you want logging insights from your entire codebase then you will need to add logging to your entire code base.
This may be an insurmountable challenge for many organizations, especially those with a large amount of legacy code baggage. No developer wants to touch code they didn’t write and don’t understand. It always comes with a significant degree of risk. What if the added logging starts breaking code that no-one on the team is able to support?
Thus, very quickly this initiative can turn into a project spanning months or years, consuming valuable resource time that could have been put to better use. And we’re really just talking code here, completely disregarding declarative customizations such as flows that are driving more and more automation these days.
There’s a Better Way
In ancient days, logs were an instrumental part of debugging. But as applications grew in size and complexity, logs became increasingly inadequate.
Over the years, the best thinkers pushed beyond logging and took a giant step forward, embracing an esoteric concept called “observability” and incorporating its principles into their troubleshooting strategies.
Observability has gained tremendous traction in recent years, especially in corporate IT environments. With its holistic approach to troubleshooting, an observability strategy can rapidly solve and proactively prevent problems that elude the best log monitoring practices. Gartner expects that by 2026, “70% of organizations successfully applying observability will achieve shorter latency for decision making, enabling competitive advantage for target business or IT processes.”
Simply defined, observability means being able to infer the internal state of a system based on its external outputs. So if your car’s radiator light comes on (the external output), you can infer that your engine is overheating (the internal state).
The concept has its origins in control theory. Rudolf Kálmán, a Hungarian-American scientist, introduced the term in 1959 paper that discussed how to manage complex systems.
It took a few decades for the concept to make the leap to hardware and software. It’s since proven to be one of the most significant developments in IT systems management.
Classic observability consists of three pillars:
-
Logs record events, errors, and warnings.
-
Metrics, per Tech Target, are “quantifiable measurements that reflect the health and performance of applications or infrastructure. For example, application metrics might track how many transactions the application handles per second, while infrastructure metrics measure how many CPU or memory resources are consumed on a server.”
-
Traces provide a detailed view of how a request moves through a distributed system. Each trace represents a single operation or transaction and tracks its journey across various components and services.
Together, these pillars provide a comprehensive view into the performance, health, and behavior of an IT system.
That’s why enterprises have brought observability into the corporate tech stack, where solutions from companies like Splunk, Datadog, and Dynatrace are today considered business critical. Unplanned downtime at an enterprise can cost millions of dollars.
Unfortunately, none of these companies offer a native observability solution for Salesforce.
Nevertheless, the platform needs this capability - especially as it becomes central to the success of so many types of organizations. Let’s face it - if you’ve deployed Salesforce, you’ve made a sizable investment. You certainly want it to function smoothly.
Observability for Salesforce
Right now, there’s just one way to realize the benefits of observability within Salesforce.
Pharos AI is a native Salesforce app that brings full-strength observability to the platform. It’s the piece that solves what’s always been missing, addressing practically every concern and limitation of the other options.
To achieve this, Pharos introduced two additional pillars to the classic trio of logs, metrics and traces:
-
Alerts send timely notifications of problems to relevant stakeholders, so teams can stay on top of issues and collaborate effectively. Alerts can be broadcast through multiple channels, including email, Slack and Teams.
-
Visualization brings the raw data of Salesforce logs to life in the form of graphs and other visual representations, making it easier to analyze what is happening within the system and gain insights.
These two pillars help support teams move from being reactive to proactive. The real-time alerts keep staff in front of issues before they impair the business. Visualization dashboards help teams find hidden patterns and unlock big-picture insights into the health of the environment, insights that would otherwise be lost in a sea of log data.
A key advantage is that Pharos does not require a retrofit of the existing code base. The application is able to automatically capture platform reported errors without the need for code or flow changes.
And because Pharos is a native Salesforce app, it inherits all of the mother platform’s security and data protection. No data ever leaves your environment, and Pharos never sees customer data. It provides the benefits of observability without having to export data for processing on a different platform.
Today, observability has emerged as the future of troubleshooting, marking a major leap forward from traditional methods. The strategy is worth exploring for any part of your tech stack, but especially for the Salesforce environment, the benefits are immediate and consequential.
So, if your team is still fending off frustrated product owners while hacking through a jungle of log files and cryptic emails, consider the promise of observability. You won't look back.
Pharos is the leading expert for observability within the Salesforce ecosystem. If you’re interested in learning more about observability and how to bring it to your Salesforce org, let us know. We’ll be happy to introduce you to additional resources.