

Easy. Powerful. Fast. Free Forever.
The wait is over. Pharos Triton is here to redefine how you manage and monitor your Salesforce org. Following in the tradition of highly regarded tools like Nebula Logger, Pharos Triton takes troubleshooting Salesforce a step further, giving you advanced logging capabilities—and a bridge to Salesforce-native observability.
The reviews are in!
Expert, hands-on experiences with Pharos Triton
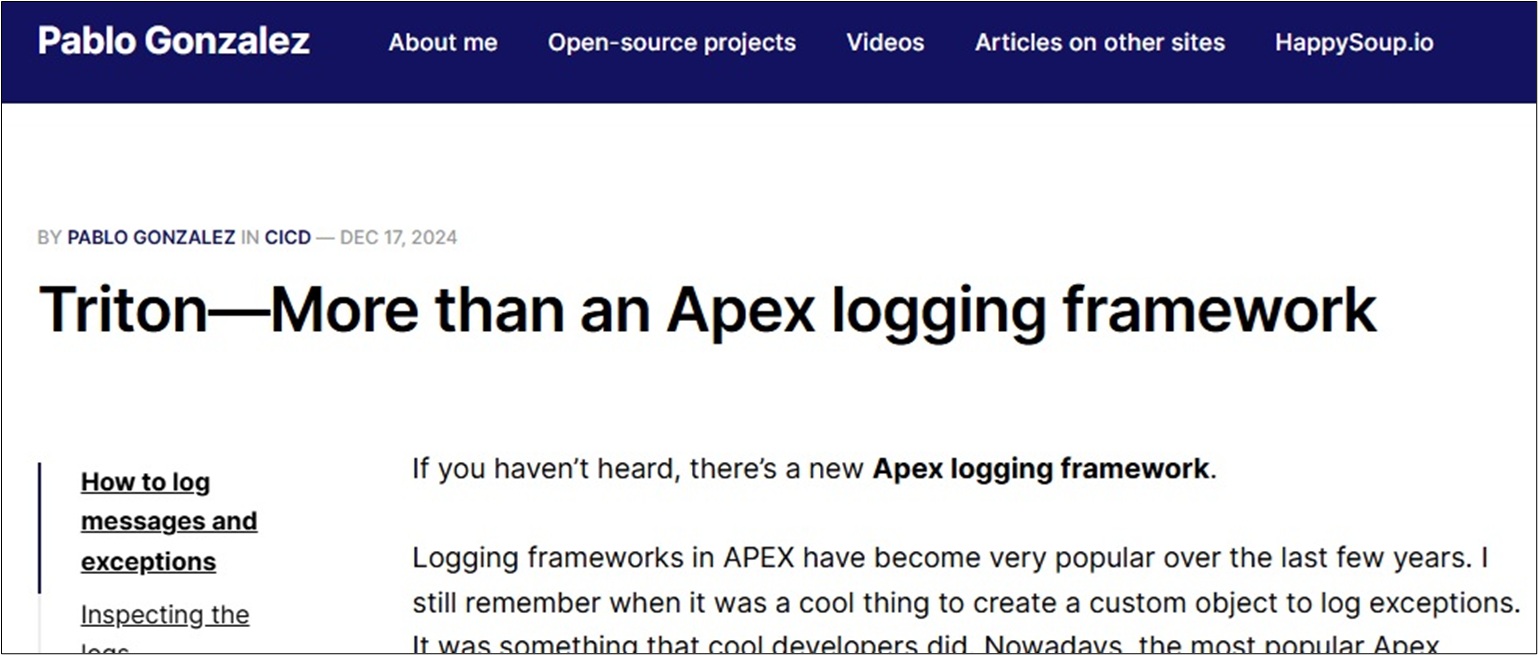
From Salesforce MVP, engineer, and author Pablo Gonzalez at pablogonzalez.io
"If you’ve never done Apex logging, then I recommend you start with Triton because it just works."
From Apex Hours at apexhours.com
"While easy and intuitive to use, Pharos Triton has a lot of sophisticated capabilities that go beyond capturing logs. It also connects to powerful observability features within the larger Pharos platform, including real-time notifications, error fingerprinting, and issue tracking."
What makes Pharos Triton unique?
Whether you're troubleshooting a complex transaction or identifying critical issues before they become showstoppers, Pharos Triton surfaces the information you need to take action. It seamlessly logs across Apex, Lightning Web Components (LWC), flows, and more—giving you complete coverage over your entire system.
Get a technical overview, detailed installation instructions, and the managed package from the Pharos Triton installation site.
Beyond these benefits, Pharos Triton also delivers automated issue tracking, smart notifications, customizable dashboards, and the ability to extract insights from your data in real-time. It’s all about helping you resolve issues faster so you can keep your Salesforce environment running smoothly.
Better than open-source.
We also want to follow in the tradition of open-source models. With Pharos Triton, you can modify the code to meet your unique circumstances, should you so desire.
How might this be helpful? What if you could combine system errors with your own custom logs to create a unified view into your automation health. Or, imagine if you could plug your own logging into the Pharos platform to leverage advanced observability capabilities, including insights and analysis.
This is exactly what Triton is for: create your own logs from Apex, LWC, and Flows, then track them alongside your org’s system errors, so you can stay in front of surprises.
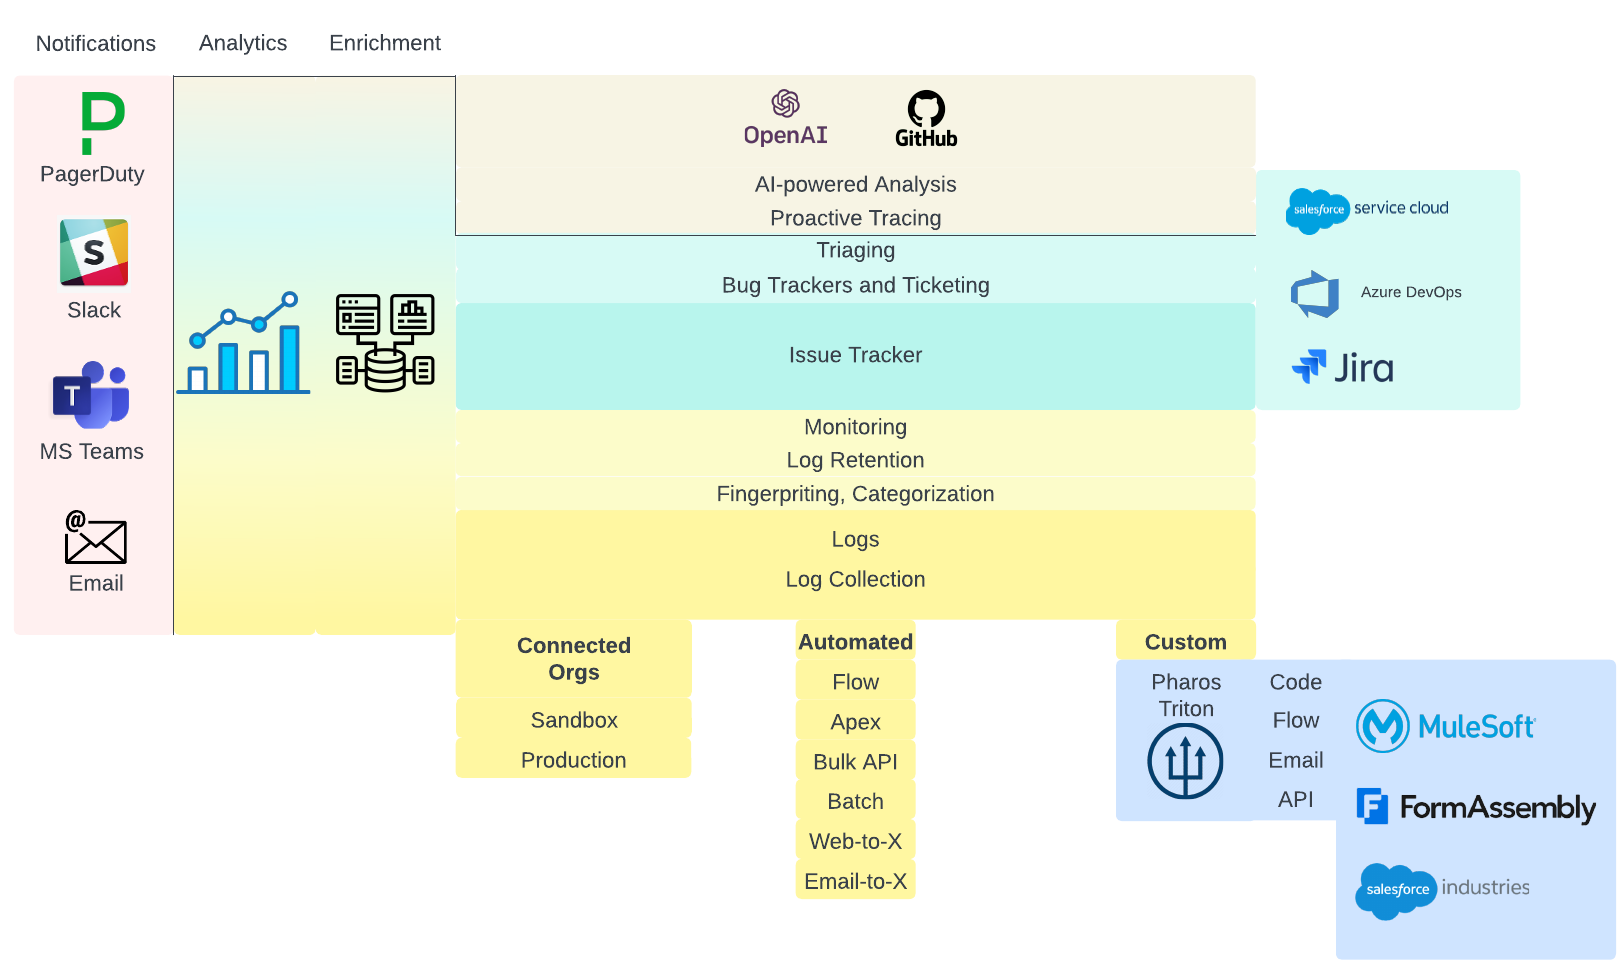
 Components of the Pharos Observability Platform and Pharos Triton
Pharos Triton is a component of the larger observability platform that is Pharos. It is responsible for ingesting log data from your automation, custom rest APIs, even emails. The diagram above outlines the various components of Pharos. Note the section on the bottom right in blue: this is Pharos Triton.
Whether you're troubleshooting a complex transaction or identifying critical issues before they become showstoppers, Pharos Triton surfaces information you need to take action. It seamlessly logs across Apex, Lightning Web Components (LWC), flows, and more—giving you complete coverage over your entire environment.
And there's one other benefit Pharos Triton provides that you won't find with open-source solutions: dedicated support. We provide ongoing support and development for Pharos Triton, so you won't have to go it alone.
Free. Forever.
The best part about Pharos Triton? It's free. We know troubleshooting Salesforce is complex because we live it. Pharos Triton is our way of giving back to the Salesforce community.
As part of the bundle, you'll also get the free-forever version of the Pharos observability package, which runs Pharos Triton. It's the world's only observability solution native to Salesforce.
Take your Salesforce troubleshooting to the next level. Get the details here, including installation instructions and a link to the Pharos installation package.
Get a technical overview, detailed installation instructions, and the managed package from the Pharos Triton installation site.

